Amazon CloudWatch
Amazon CloudWatch is a robust monitoring and observability service that tracks your AWS resources and the applications you run on AWS in real time. It provides system-wide visibility into resource utilization, application performance, and operational health.
Core Benefits
CloudWatch empowers users with enhanced operational capabilities:
- Visualize and Analyze Resources: Offers customizable dashboards to monitor resources and applications in a single, integrated view.
- Operate Efficiently with Automation: Enables automated responses to operational events, such as scaling resources based on performance metrics.
- Integrated View: Consolidates metrics, logs, and alarms from across your AWS environment for holistic monitoring.
- Proactive Monitoring: Allows you to set alarms on critical metrics to be notified of potential issues before they impact users.
- Gain Insights: Helps analyze log data and metric trends to identify performance bottlenecks and application errors.
Use Cases
- Monitor and Troubleshoot Infrastructure: Gain deep insights into the health and performance of your AWS resources, like EC2 instances, databases, and serverless functions.
- Application Performance Monitoring: Collect and analyze application-specific metrics and logs to identify and resolve performance issues and errors.
- Automated Scaling and Remediation: Configure alarms to trigger automated actions, such as scaling EC2 instances up or down, or initiating other corrective measures.
Example:
A retail company uses CloudWatch to monitor their application running on Amazon Elastic Compute Cloud (Amazon EC2) instances. CloudWatch automatically collects metrics like CPU utilization on the EC2 instances.
The company configures CloudWatch to collect application performance logs. They set up alarms to notify them when EC2 utilization is high for an extended period, with an action configured to automatically scale up the number of EC2 instances.
Finally, they create a custom dashboard to visualize all metrics, logs, and alarms in one place, allowing them to analyze performance issues or application errors effectively.
Key Features
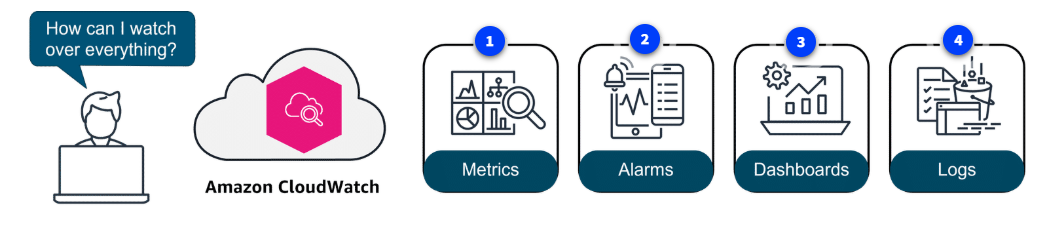
Metrics
CloudWatch automatically collects metrics from all your AWS resources, applications, and services that run on AWS, as well as from on-premises servers. These metrics are time-ordered sets of data points that represent the performance and operational health of your resources. You can publish your own custom metrics to CloudWatch to monitor application-specific data.
Alarms
CloudWatch Alarms allow you to set thresholds on any CloudWatch metric. When a metric breaches a specified threshold for a defined period, the alarm can trigger notifications (e.g., via Amazon SNS) or automate actions (e.g., stopping an EC2 instance, adding instances to an Auto Scaling group, or invoking a Lambda function). This enables proactive management and automated responses to operational events.
Dashboards
CloudWatch Dashboards are customizable home pages within the CloudWatch console that allow you to monitor your resources in a single, consolidated view. You can create dashboards to display graphs of metrics, log data, and alarm statuses, making it easy to visualize trends, identify issues, and maintain a holistic overview of your operational health.
Logs
CloudWatch Logs enables you to centralize log files from various sources across your AWS environment, including Amazon EC2 instances, AWS CloudTrail, Route 53, and other applications. You can monitor, store, and access your log files, and also use log subscriptions to stream them to other services for further analysis. This feature provides powerful capabilities for searching, filtering, and analyzing log data to troubleshoot issues and gain operational insights.
Amazon CloudWatch is the foundational monitoring and observability service for AWS, offering a unified platform to collect metrics, logs, and events, enabling real-time insights and automated management of your cloud resources and applications.
Use case: Critical for DevOps teams, system administrators, and developers who need to monitor application health, track resource performance, troubleshoot issues, and ensure the operational efficiency and reliability of their AWS workloads.